Statistical hypotheses
- Null hypothesis (H0): No difference or relation exists; e.g. Treatment A is not better than Treatment B
- Alternative or research hypothesis (H1): Some difference or relation exists, e.g. Treatment A is better than Treatment B
Statistical errors
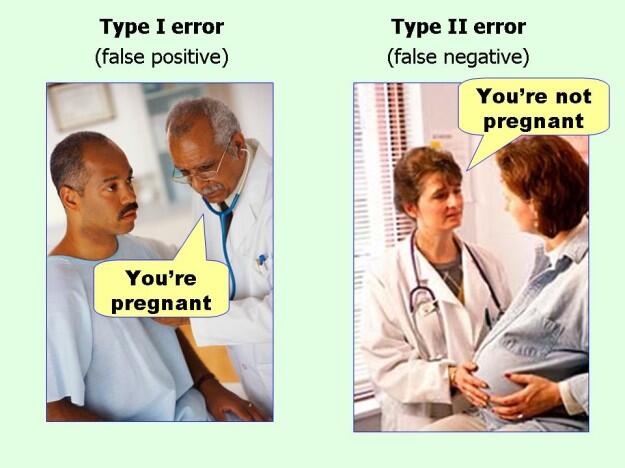
- Type I error (alpha): False positive (Falsely rejecting Null-hypothesis; i.e. null hypothesis is actually true but rejected)
- Type II error (beta): False negative (Falsely accepting Null-hypothesis; i.e. null hypothesis is actually false but not rejected)
You can never prove alternate hyopthesis, but you can reject the null hypothesis.
Mnemonic:
Alpha error (Type I) → false Positive error → The P in Positive has one (I) vertical line, so corresponds to type I
Beta error (Type II) → false Negative error → The N in negative has two (II) vertical lines, so corresponds to type II
Alpha and P-value
P value: Probability of type I error
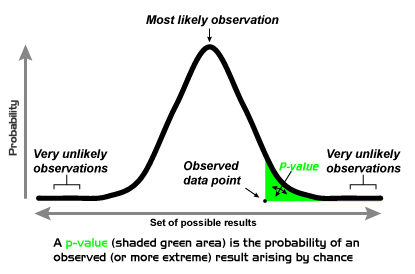
Alpha: Significance level – maximum tolerable probability of type I error
- a significance level of 0.05 indicates a 5% risk of concluding that a difference exists when there is no actual difference.
Alpha sets the standard for how extreme the data must be before we can reject the null hypothesis. The p-value indicates how extreme the data are. We compare the p-value with the alpha to determine whether the observed data are statistically significantly different from the null hypothesis:
a. If P-value < or = alpha: Null hypothesis rejected (result is statistically significant)
b. If P-value > alpha: Null hypothesis not rejected (result is statistically non-significant)
Mnemonic:
When assessing P-Value vs. Alpha:
a. If P(enis) is small (i.e. P-value < Alpha) –> REJECT (the null (nude))
b. If P(enis) is big (i.e. P-value > Alpha) –> ACCEPT (the null (nude))
P-value is the probability that the observed difference between groups is due to chance (random sampling error) when null hypothesis is true. So, if my p-value is less than alpha (<0.05), then there is less than 5% probability that the null-hypothesis is truer.
Beta and Power
Beta: Probability of type II error
Power: Probability of correctly rejecting null hypothesis (true positive)
- Power = 1 – Beta
- Statistical power can be increased by: increasing sample size, reducing beta and increasing sensitivity
- By convention, most studies aim to achieve 80% statistical power
4 Inter-related features of Power:
Mnemonic: BEAN
1. Beta error: As beta increases, power decreases
2. Effect size: As effect size increases, power increases
3. Alpha error: As alpha error increases, power increases
4. N (Sample size): As sample size increases, power increases
Confidence interval and confidence level
Confidence interval (CI): Interval within which a parameter value is expected to lie with certain confidence levels (1-alpha), as could be revealed by repeated samples.
- CI for sample mean = Mean +/- z (Standard error or SE)
- SE = Standard deviation or SD/√sample size or n
- Larger thhe sample size, narrower is CI
- Smaller the SD, narrower is CI
- There is no way to achieve 100% confidence
- Confidence limits are the upper and lower boundaries of confidence intervals
Corresponding to alpha = 0.5, 95% CI is often used.
- For 95% CI, Z = 1.96.
- For 99% CI, Z = 2.58.
Interpretation
- Overlapping confidence intervals between two groups signify that there is no statistically significant difference.
- Non-overlapping confidence intervals between two groups signify that there is a statistically significant difference.
- If the confidence interval includes the null hypothesis, the result is not significant and the null hypothesis cannot be rejected.
- If the 95% confidence interval of relative risk or odds ratio includes 1.0, the result is not significant and the null hypothesis cannot be rejected.
- If the 95% confidence interval of a difference between the means of two variables includes 0, the result is not significant and the null hypothesis cannot be rejected.
- A 95% confidence interval that does not include the null hypothesis corresponds to a p-value of 0.05
- A 99% confidence interval that does not include the null hypothesis corresponds to a p-value of 0.01