There is an old saying that two surgeons and an ECG form a double-blind-study. Then, there’s a protocol for surgeons intended for humor:
- All spikes up: Operate
- All spikes down: Call Medics
- All spikes missing:
- Recently: Call Anesthetist
- A long time ago: Complete death certificate
So, let’s think of heart as a cefazolin pump and ECG as “A RARE P-QRS-T” thing and approach the ECG to interpret it.
Mnemonic: A RARE P-QRS-T (V. Dimov approach)
1. Age
2. Rate:
- Atrial rate (between same points in 2 P waves) and Ventricular rate (between 2 R waves)
- <3 squares between each QRS complex = >100 bpm (tachycardia)
- >6 squares between each QRS complex = <50 bpm (bradycardia)
You can use the 300 method (large boxes) or 1500 method (small boxes) or use a sequence of 300, 150, 100, 75, 60, 50 for rapid estimation of the heart rate.
3. Axis:
Axis can be crudely determined with the thumb rule looking at only 2 leads – I and aVF. Imagine that your left thumb is lead I and right thumb is lead aVF. Thumbs up represent positive deflections and thumbs down represent negative deflections.
| Left thumb (Lead I) | Right thumb (Lead aVF) | Interpretation |
| 🠕 | 🠕 | Normal |
| 🠕 | ↓ | Left axis deviation |
| ↓ | 🠕 | Right axis deviation |
| ↓ | ↓ | Indeterminate axis |
4. Rhythm:
- Is it regular (same no. of squares between each QRS) or irregular (variable no. of squares between each QRS)?
- Check for P before each QRS and QRS after each P (to see if the rhythm is sinus, i.e. the rhythm starts in SA node).
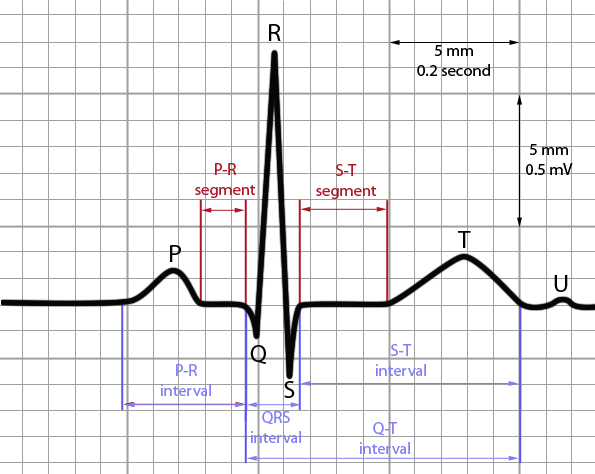
5. Evaluate each ECG elements:
a. P:
| Wave (lead II) | Interpretation | Interval | Interpretation |
| <3 squares in width & <2.5 squares in height; may be biphasic in V1 (up an down) | Normal P wave | 3-5 boxes | Normal PR interval |
| Taller than 2.5 sqaures (P pulmonale) | Right atrial enlargement (usually due to pulmonary hypertension) | Longer than 5 sqaures | Heart block (AV node block) |
| Longer than 3 squares +/- notch i.e. bifid (P mitrale) | Left atrial enlargement (P. mitrale in mitral stenosis) | Shorter than 5 sqaures | Accessory pathway between atria and ventricle (WPW syndrome); AV nodal rhythm |
| Inverted (Retrograde) | Non-sinus rhythm (AV nodal rhythm) | ||
| Variable morphology | Multiple ectopic pacemakers | ||
| Absent | Sinus arrest, AVNRT | ||
| Flutter (saw-tooth) waves | Atrial flutter | ||
| Fibrillations | Atrial fibrillation | ||
| >1 P wave before QRS | Heart block |
b. QRS:
- Width:
- 1.25-3 boxes: Normal
- >3 boxes: Broad/Wide QRS (Slow conduction in ventricle or AV nodal/ventricular origin of electrical activity)
- Bundle branch block
- Hyperkalemia
- Hypothermia
- WPW syndrome
- <1.5 boxes: Narrow/Supraventricular QRS (Supraventricular origin of conduction
- Normal P waves: Sinus tachycardia
- Regular flutter waves: Atrial flutter
- No P waves: AV nodal tachycardia
- Height:
- 5 boxes (in >/=1 standard lead) or 10 boxes (in >/=1 precordial lead) – 25 boxes: Normal voltage
- Low voltage: Damping effect of fluid/flat/air or loss of viable myocardium or restrictive heart disease
- Fluid: Effusion (Pericardial or Pleural)
- Fat: Obesity
- Air: Emphysema, Pneumothorax
- Loss of viable myocardium: Infarction or Cardiomyopathy
- Infiltrative disorders: Myxedema, Constrictive pericarditis, Restrictive myocarditis
- High voltage:
- Voltage criteria: S wave depth in V1 + tallest R wave height in V5-V6 > 35 mm (Left ventricular hypertrophy)
- Alternans (alternating in height): Massive pericardial effusion
c. T:
| T Wave | Interpretation | ST segment | Interpretation |
| Same direction as R wave (usually upside down in aVR and lead I), <5 boxes tall and <10 boxes tall in precordial lead | Normal | Level with baseline; upto 1 box elevation or depression from baseline; upto 3 box elevation in V2-V3 | Normal |
| Asymmetric and not narrow tall T waves | Normal variant | Convex, straight upsloping, straight horizontal or straight downsloping ST elevation | Myocardial infarction |
| Symmetric, narrow based, pointing tall T waves | Hyperkalemia | Concave ST elevation | Pericarditis |
| Symmetric, broad based, non-pointing tall T waves | Hyperacute ischemia | ||
| Asymmetric inverted T wave | Strain pattern | ||
| Symmetric inverted T wave | Ischemia (Old if no ST depression) | ||
| Gigantic/deep inverted T waves | Cerebrovascular insult |
To confirm STEMI we can use algorithm proposed from Stephanie et all. (2012), which involves four simple steps:
1. Is there ST elevation of at least 1 to 2 mm in 2 anatomically oriented leads)?
2. Is sum of the Q wave in lead V1/V2 + R-wave in lead V5/V6 less than 35 mm?
3. Is the QRS complex less than 0.12 second in width?
4. Is there ST-segment depression present in at least 1 lead?
In cases where all four criteria of this algorithm are fulfilled, diagnosis of STEMI is confirmed. In cases where even only one criterion isn’t fulfilled, then a diagnosis of STEMI can be in some degree of doubt.
Excellent 👍🏾. Thank you thank you and thank you. This is very helpful
Thank u for the breakdown on each wave, but for each explanation I think it should be followed by graphical example of what each wave would look like on the ECGgraph for better understanding