Cardiac Cycle
Opening and closing of valves
When the valve opens, different compartments act as a single chamber (atrio-ventricle or aorto-ventricle). For a blood to flow, pressure in “giver” must be higher then that in “receiver”.
Pressure difference opens or closes the valve:
- Higher pressure in “giver” opens the valve:
- Atrial pressure > Ventricular pressure: Atrioventricular valves open
- Ventricular pressure > Outflow tract pressure: Semilunar valves open
- Higher pressure in “receiver” closes the valve:
- Ventricular pressure > Atrial pressure: Atrioventricular valves close
- Outflow tract pressure > Ventricular pressure: Semilunar valves close
Role of atrial contraction in Ventricular filling
Except during the ventricular systole, atrial pressure exceeds the ventricular pressure. Hence, atrioventricular valve remains open throughout ventricular systole and ventricular filling occurs throughout this period. Atrial contraction or systole is not necessary for ventricular filling. In fact, 80% of the filling occurs during atrial diastole (passive filling) and only 20% during the atrial systole (active filling).
Isovolumetric contraction and relaxation
When all the valves in heart are closed, heart acts as a closed chamber. During this period, the volume within the ventricle doesn’t change during contraction or relaxation and is termed as “isovolumetric”. The pressure of ventricle slopes, i.e. either rapidly rises during contraction or rapidly falls during relaxation.
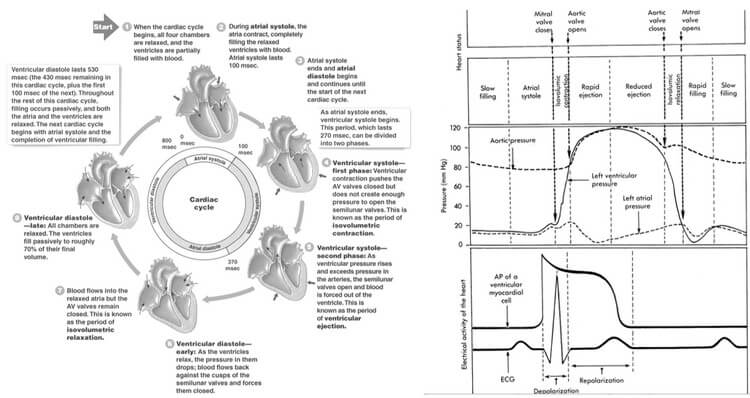
Dicrotic notch and Incisura
Systolic pressure in outflow tracts (aorta and pulmonary arteries) are generated by the flow of blood in them during ventricular contraction. Hence, pressure in them begins to rise only when the ventricular pressure slightly exceeds the diastolic pressure in these vessels leading to opening of the semilunar valves. Throughout the systole, the pressure is slightly higher in ventricles than in outflow tracts, keeping the semilunar valves open.
During relaxation, diastolic blood pressure in ventricles falls to much lower levels compared to the aorta. This is because of the elasticity of the aorta. It recoils back to maintain the pressure. Initially, the pressure in the outflow tracts and ventricles fall simultaneously. When the elastic recoil of expanded outflow vessels overcome the decreasing pressure in the ventricles, semilunar valves close. This gives rise to dicrotic notch, when the relaxation of outflow tracts and the ventricles follow separate paths. This helps to maintain a continuous perfusion to the organs and this property of elastic arteries is also known as “Windkessel effect“.
The blood flows from the ventricles to the outflow tracts until the diastolic pressure of these overcome that of the ventricles and the semilunar valves close. But blood has inertia, and hence due to this property, the blood momentarily continues the forward flow even when the semilunar valves have closed. This leads to a “blip” of aortic pressure rise and is termed as “incisura“.
Atrial and Ventricular Cycle and Diastasis
Considering a heart rate of 75/min. The duration of 1 cardiac cycle is 0.8 seconds. The cycles are different in the atria and the ventricles.
Atrial systole makes up only 0.1 second and is responsible for active ventricular filling. The remaining 0.7 seconds, the atria relaxes and receives venous return from the venacavae.
Ventricular systole begins when the atrial systole ends and makes up about 0.3 seconds (more precisely 0.27 seconds, i.e. 1/3rd of the cardiac cycle), during which the atrio-ventricular valves are closed. Following systole, at the end of 0.1 seconds of isovolumetric relaxation, the atrioventricular valves open. There is passive filling of the ventricles during the remaining 0.3 seconds.
During the passive ventricular filling (0.3 seconds):
- 1st 0.1 second: The blood accumulated in the atria during the ventricular systole rapidly flow into the ventricles (rapid ventricular filling) due to a higher pressure in atria compared to ventricles.
- 2nd 0.2 seconds: When the ventricular pressure approaches atrial pressures, the great vessels, atria and ventricles act as a continuous single chamber – and a very little or no ventricular filling occurs during this period. This period is known as diastasis and most compromised during the increase in heart rate.
Remaining 0.1 seconds of ventricular diastole corresponds to the atrial systole, i.e. active ventricular filling.
Heart sounds
First (S1): Closure of atrioventricular valves
- Split S1 results from asynchronous closure of mitral (M1) and tricuspid (T1) valves. M1 is usually the earlier component, with T1 normally occuring ~20-30 msec after M1. The splitting is not appreciable with human ear normally.
Second (S2): Closure of semilunar valves
- Split S2 results from asynchronous closure of aortic (A2) and pulmonic (P2) valves. Normally, the separation of A2 and P2 is ~40 msec during inspiration. During inspiration, aortic valve closes earlier due to bulging of interventricular septum into the left ventricle reducing it’s capacity. This is due to negative intrathoracic pressure that drives more venous return into the right side of the heart. Delayed closure of pulmonary valves is attributed to the pooling of the blood in the pulmonary circulation.
Third (S3) or Ventricular gallop: During passive rapid ventricular filling
- Can be normal in children and pregnant women.
- It is produced when the blood strikes overtly compliant dilated ventricles as in volume overload or systolic failure.
Fourth (S4) or Atrial gallop: During active ventricular filling or atrial systole
- Always pathological
- It is produced by forcing of blood by atrial contraction into the non-compliant ventricle through the atrioventricular valves and suggests diastolic failure of heart.
- Diastolic failure occurs in concentric hypertrophy (systemic hypertension) and acute MI (inadequate ATP to separate actin-myosin crossbridge).
Normal Intracardiac and Vascular Pressures
- Right atrium: 0-8 mmHg (average 4 mmHg; varies with respiration)
- Right ventricle: 15-30/0-8 mmHg (average 25/4 mmHg)
- Pulmonary artery: 15-30/3-12 mmHg (average 25/10 mmHg)
- Left atrium: 1-12 mmHg (average 10 mmHg)
- Left ventricle: 100-140/3-12 mmHg (average 120/10 mmHg)
- Aorta: 100-140/60-90 mmHg (average 120/80 mmHg)
Notice, the pressure of atria is the diastolic pressure of ventricles. The systolic pressure of ventricles and outflow tracts are the same. The diastolic pressure of ventricles is less compared to that of outflow tracts due to elasticity of these vessels.
Jugular Venous Waves
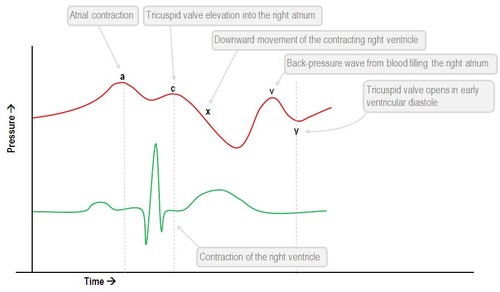
The normal JVP consists of 3 ascents or positive waves (a,c and v) and 2 descents or negative waves (x,x’ and y):
- a wave (ascent): due to active atrial contraction leading to retrograde blood flow into neck veins
- x wave (descent): Due to continued atrial relaxation
- c wave: due to impact of the carotid artery adjacent to the jugular vein and retrograde transmission of a positive wave in the right atrium produced by the right ventricular systole and the bulging of the tricuspid valve into the right atrium.
- x’ wave (descent): due to descent of floor of right atrium (tricuspid valve) during right ventricular systole and continued atrial relaxation
- v wave (ascent): due to passive atrial filling (venous filling)
- y wave (descent): due to opening of tricupsid valve and subsequent rapid inflow of blood from right atrium into the right ventricle leading to a sudden fall in right atrial pressure.
How to draw Wigger’s Diagram of Cardiac Cycle?
You’ll definitely make mistakes if you mug-up this complex diagram without understanding the basic concepts. Once, you’ve understood, you can easily reproduce it.
Mnemonic for sequence of events in cardiac cycle: PaQ1 cxT2 v3y
- P wave (ECG)
- a wave (JVP)
- Q wave (ECG)
- S1
- c wave (JVP)
- x-descent (JVP)
- T wave (ECG)
- S2
- v wave (JVP)
- y descent (JVP)
- S3
1. Draw the Electrical Cardiac Cycle Events (ECG):
Always start with the ECG. In ECG, R-R interval is the duration of cardiac cycle and 1 R-R interval represents 1 cardiac cycle.
- Peak of R wave: Corresponds to beginning of ventricular systole
- Middle of T wave: Corresponds to beginning of ventricular diastole
- Middle of P wave: Corresponds to beginning of atrial systole
This also gives the idea of duration of the stages of cardiac cycle.
2. Draw the Mechanical Cardiac cycle Events:
The 3 bulges in jugular venous waves (pulse) represents the rise in atrial pressure:
- “a” wave: atrial contraction (appears after P wave in ECG)
- “c” wave: bulging of atrioventricular valves back into the atria due to ventricular contraction (appears after QRS complex in ECG)
- “v” wave: rise in atrial pressure due to continuous venous filling of atria (appears after T wave in ECG)
Ventricular and aortic pressure changes: Let us talk focusing only the left side of heart –
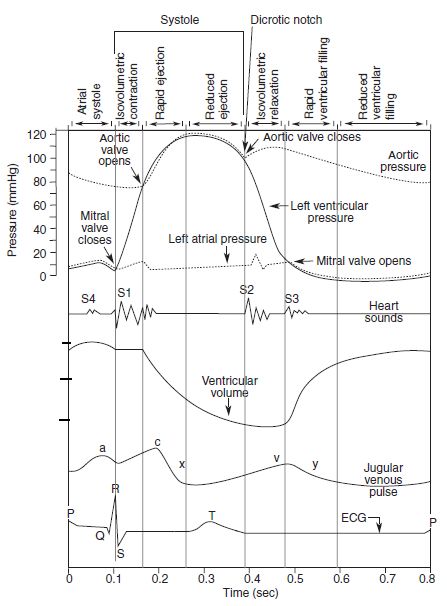
- At the end of atrial systole, ventricles are closed chambers with both the aortic and mitral valves closed. Isovolumetric ventricular contraction raises the ventricular pressure rapidly to 80 mmHg.
- When ventricular pressure just exceeds 80 mmHg, the aortic valve opens and the “sloppy” pressure rise becomes more gradual. As the blood runs off into the aorta, the pressure in the aorta simultaneously rises with that of left ventricle upto 120 mmHg and falls upto 80 mmHg. Throughout this period, ejection of blood occurs:
- 1/3rd of ejection period (pressure rises from 80 to 120 mmHg): rapid ejection occurs (70% volume ejection)
- 2/3rd of ejection period (pressure falls from 120 to 80 mmHg): reduced or slow ejection occurs (30% volume ejection)
- Once, the pressure approaches 80 mmHg, the elastic recoil of aorta overcomes falling ventricular pressure leading to closure of aortic valve and the ventricular pressure continues to fall down. Due to inertia of flowing blood, blood momentarily hits the closed aortic valve just after it’s closure giving rise to “incisura“.
- Once again the ventricle is a closed chamber when the semilunar valve closes. During isovolumetric relaxation, there is “sloppy” fall in ventricular pressure to 10 mmHg and the aortic pressure is maintained in it’s diastolic pressure (80 mmHg) which ensures continuous perfusion of organs even during ventricular diastole.
- When the mitral valve opens, there is rapid ejection of blood from atrium to ventricle – leading to fall in atrial pressure (end of “v” wave in JVP and beginning of “y” descent).
- When the pressure in ventricle approaches that of atrium, they act as a single chamber and very little or no blood is filled into ventricle during this period and is known as “diastasis“. This is the longest period of diastole (about 0.2 seconds).
Ventricular volume changes:
Remember the concept of End diastolic volume (EDV), End systolic volume (ESV) and Stroke Volume (SV).
SV = EDV – ESV
- EDV = 130 ml
- ESV = 50 ml
- SV = 80 ml
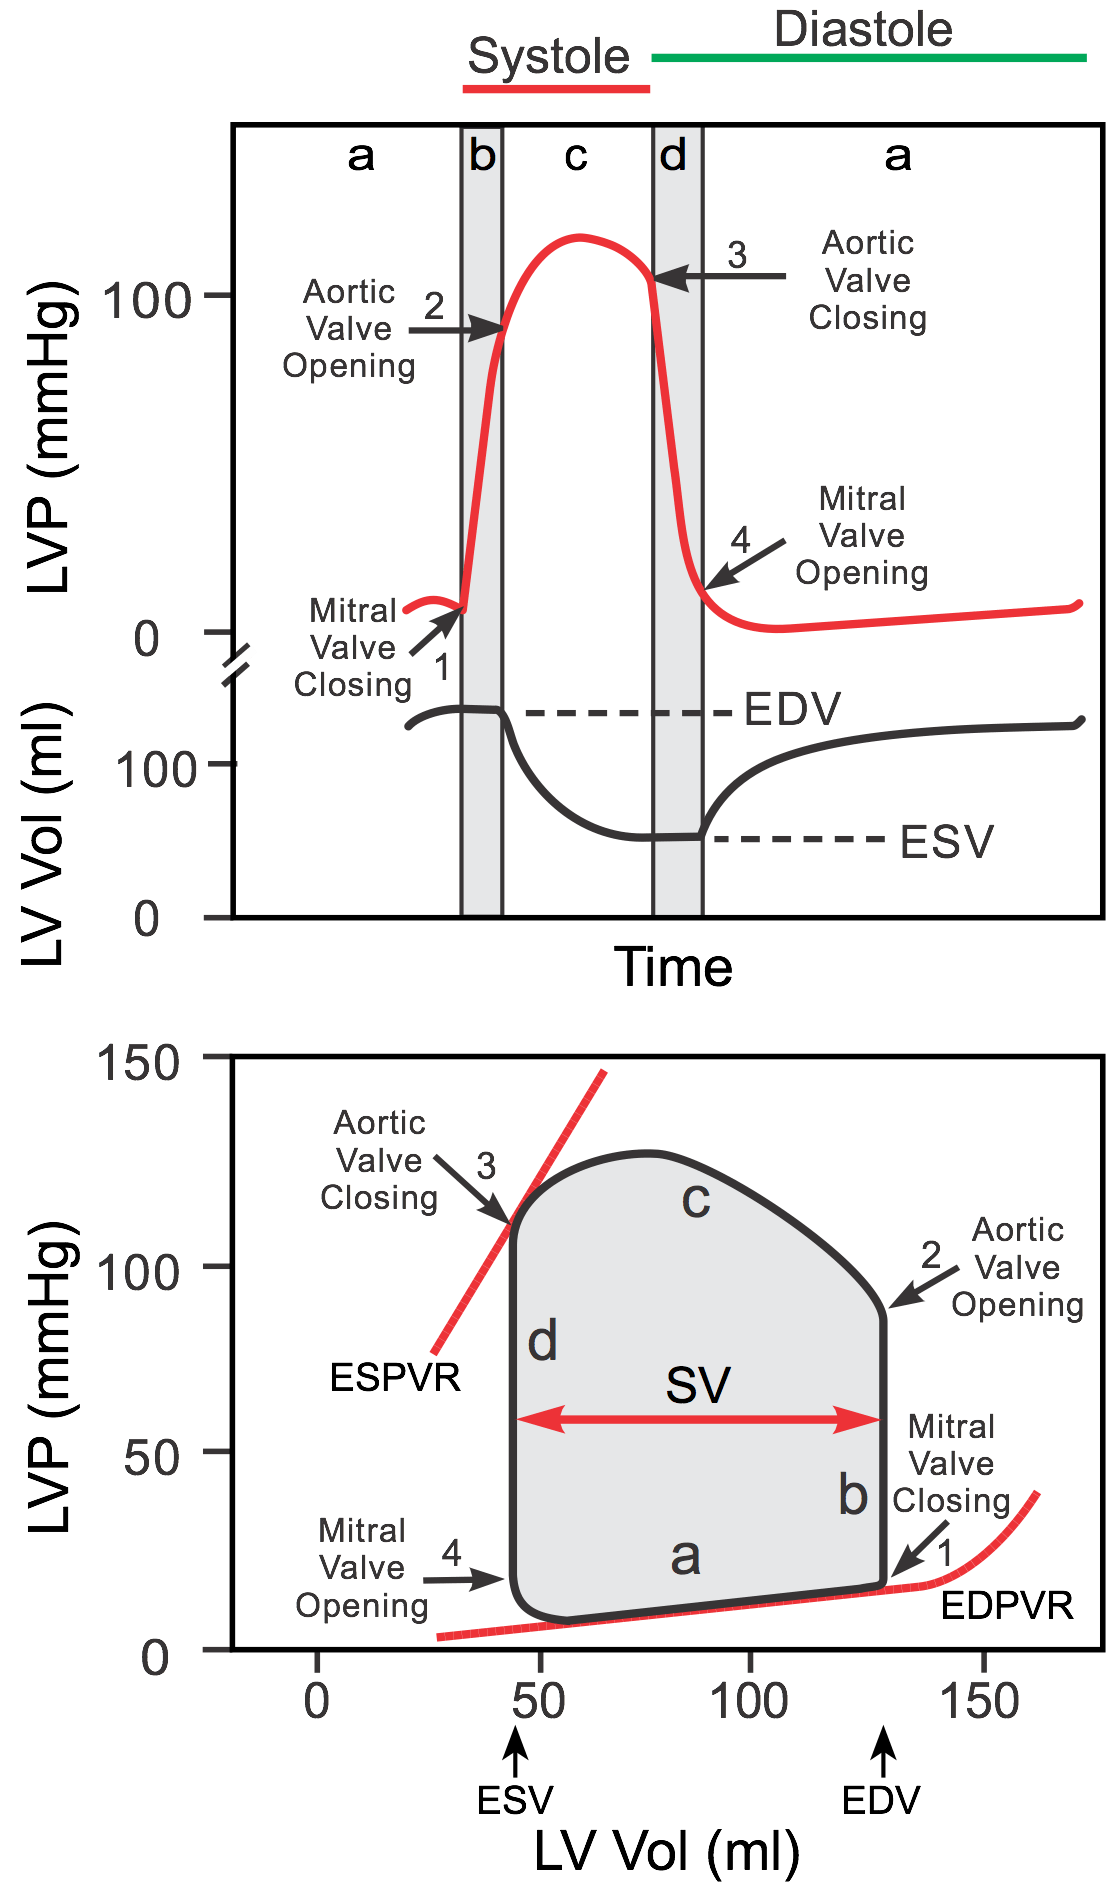
Volumes:
- At the end of ventricular diastole (just before systole): EDV, i.e. 130 ml
- Volume remains same during isovolumetric contraction = 130 ml
- Rapid ejection phase = 70% of stroke volume is ejected, i.e. about 55 ml is ejected
- At the end of rapid ejection phase = 130-55 ml = 75 ml
- Remaining 25 ml is ejected during reduced ejection phase
- By the end of reduced ejection phase, we have End systolic volume = 50 ml
- Volume remains same during isovolumetric relaxation = 50 ml
- 80% of ventricular filling (EDV) occurs before atrial contraction = rises to 105 ml
- Remaining 25 ml is filled by atrial contraction = EDV, i.e. 130 ml
Total electromechanical systole (Q-S2 or Q-A2 interval): It is the period from the onset of QRS complex to the closure of the aortic valve, as determined by the onset of 2nd heart sound.
Left ventricular ejection time (LVET): It is the interval between the carotid upstroke and the dicrotic notch.
Pre-ejection period (PEP): Subtraction of LVET from Q-S2
Cardiac cycle is the foundation upon which you build up the knowledge of the cardiology.
This is detailed and well explained. Medical students and even professional who would want to refresh their knowledge on cardiac cycle can benefit from this great article.