History:
In 1972, Sir Godfrey Hounsfield developed CT scan for which he was awarded Nobel prize in 1979. Through these years CT has come from one rotation in 6 minutes to one in 0.33 seconds.
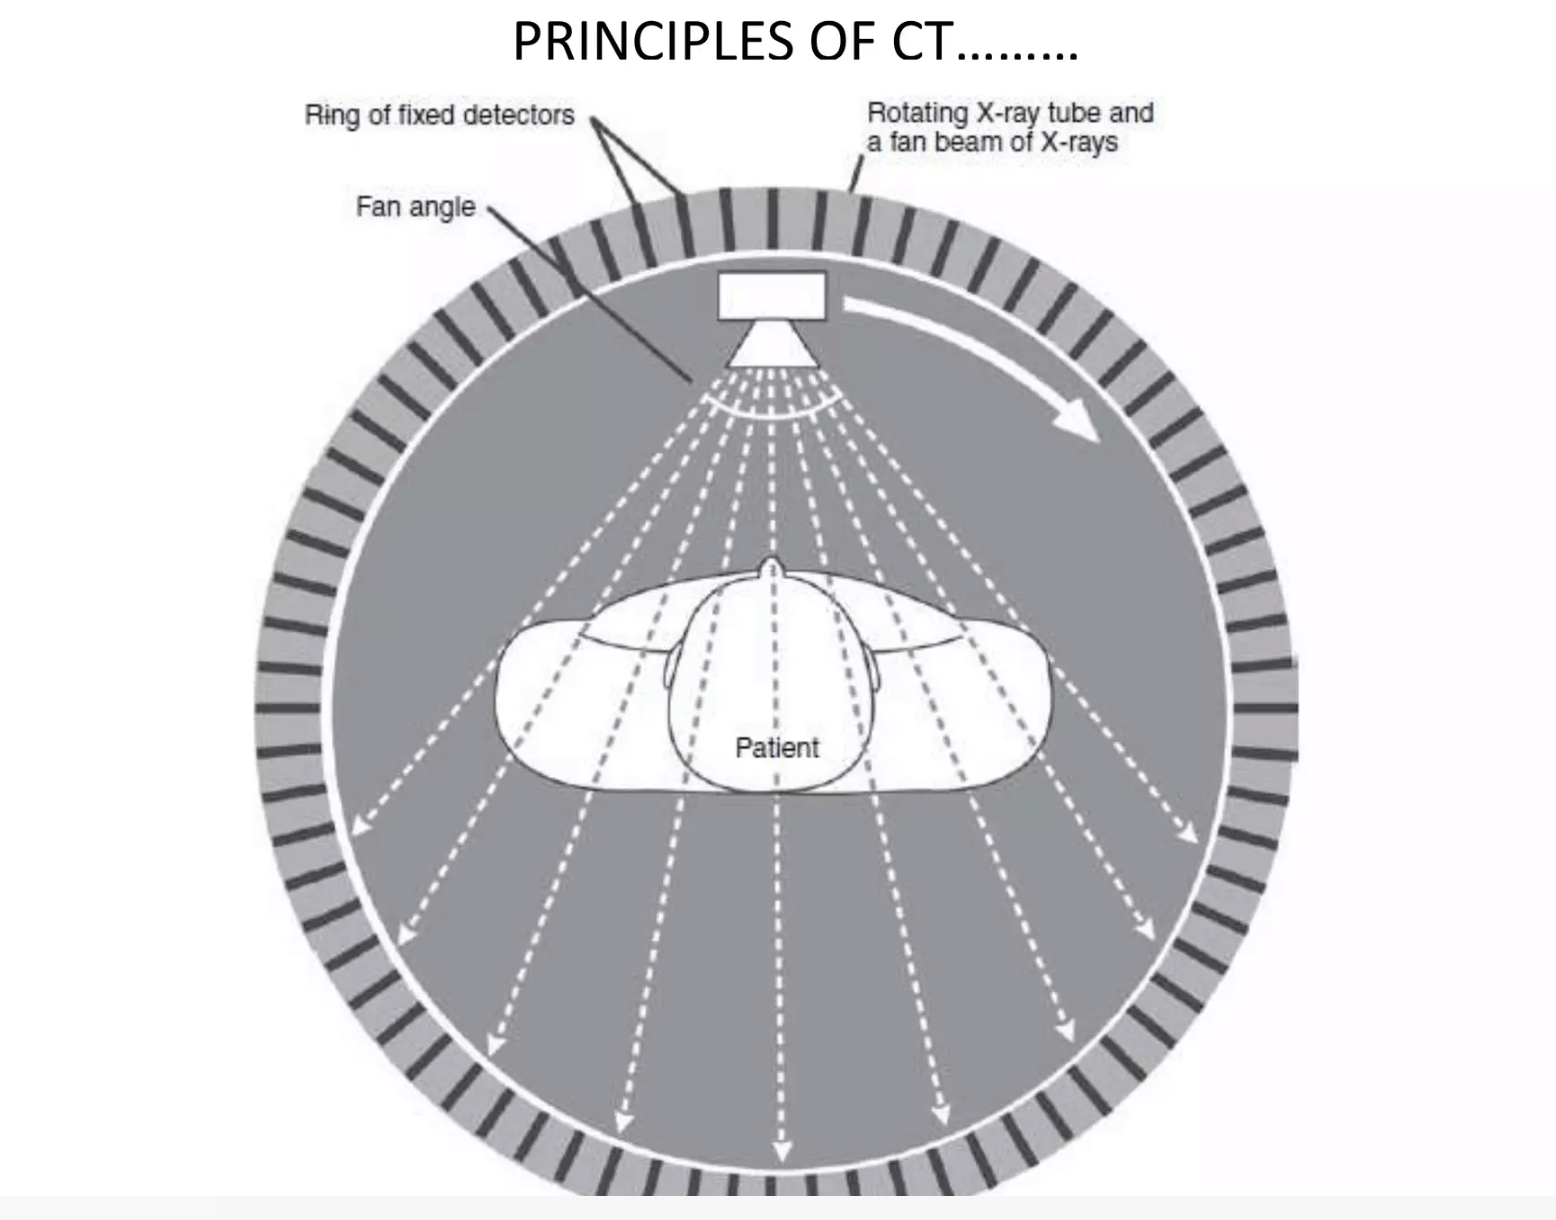
Principle:
X rays are produced by CT machine, which are absorbed by different tissues in different degrees. CT machine has Xray source and detectors which are 180 degrees around each other and move 360 degrees around the patient.
- Gray scale axial image is generated, which can distinguish small differences in density
- For body tissue the amount of attenuation is relatively constant known as attenuation coefficient
- The absorption data is used in a computer to reconstruct HD images which is measured in Hounsfield unit (HU)
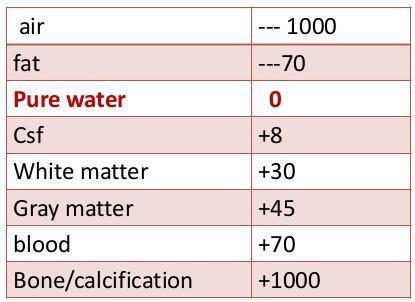
Hounsfield units of different tissues:
Windowing:
- It is also known as grey scale mapping
- It can identify subtle differences in tissues
- We can highlight particular structures which we need to see
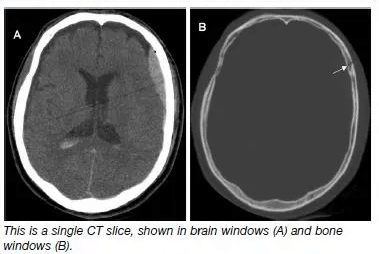
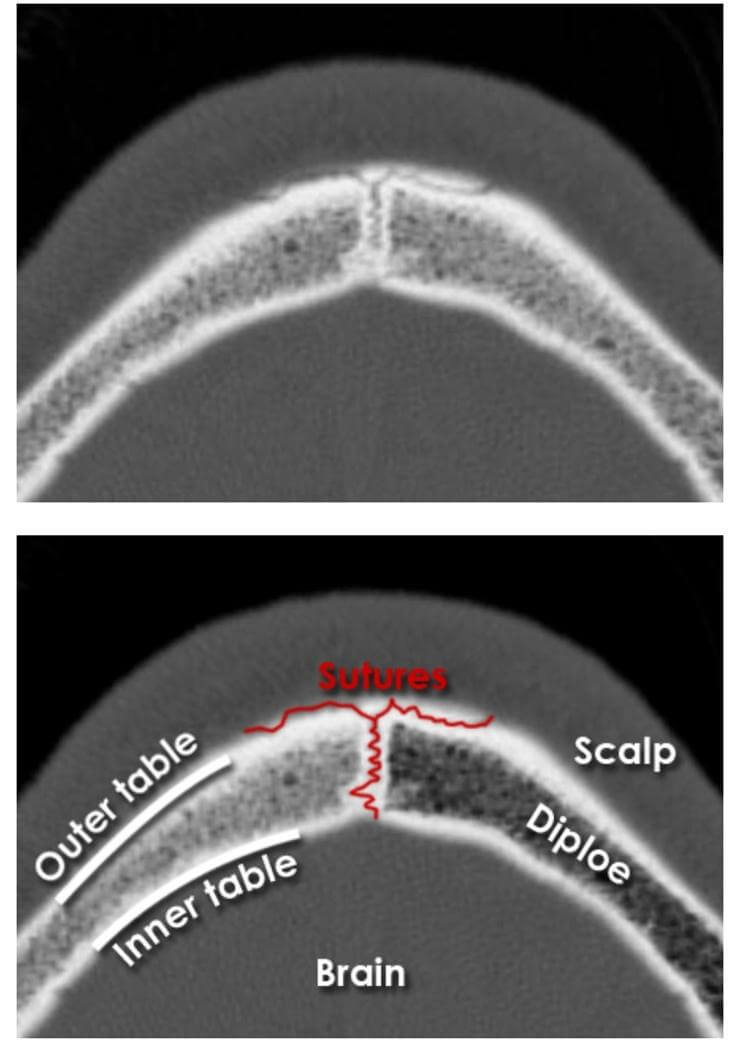
Bone window (only skull bone is seen with no brain parenchymal components)
Slice thickness: may vary; we generally get a slice thickness of 5 mm to 10 mm for a routine head CT.
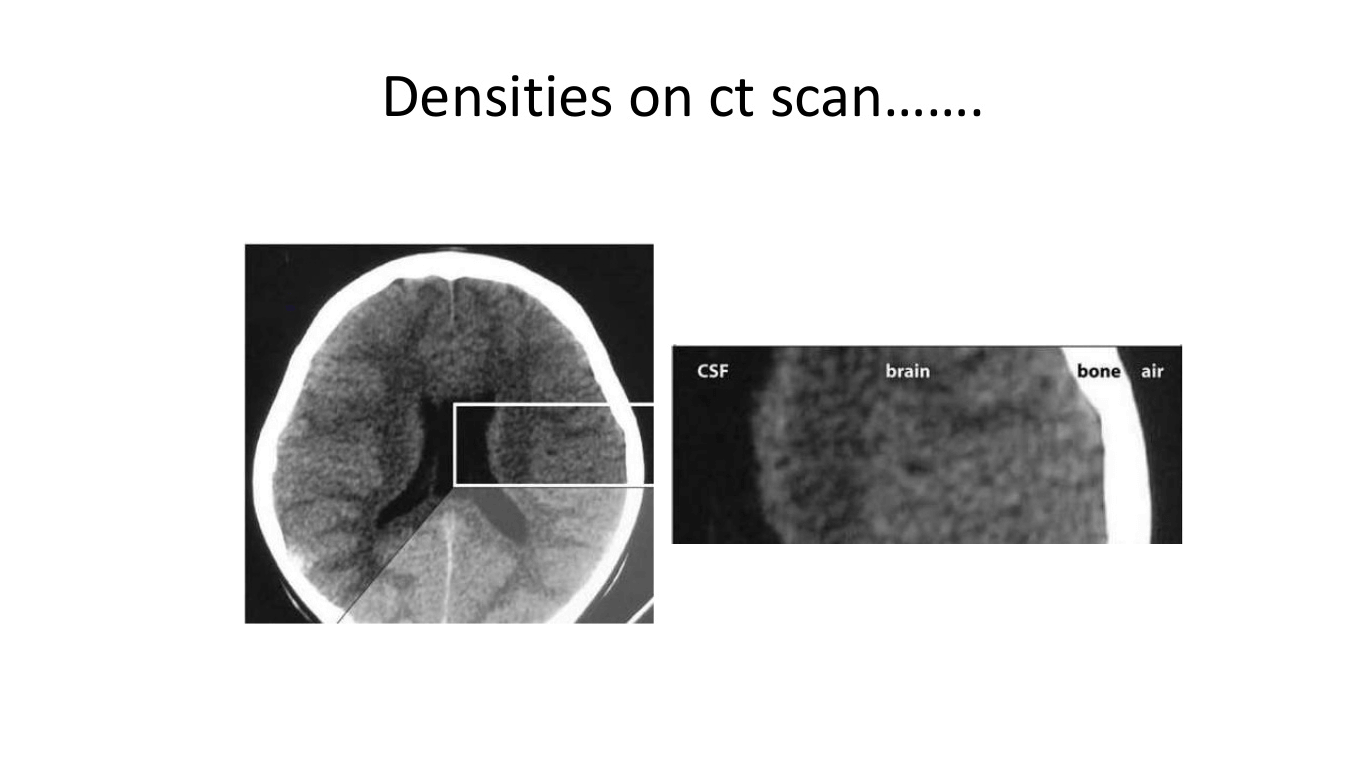
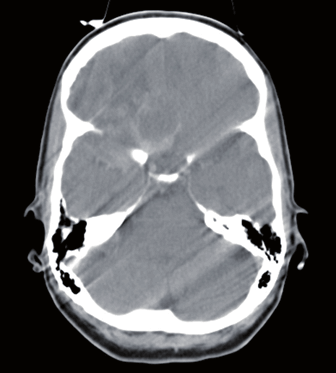
Parenchyma and densities:
- gray matter appears light (located peripherally)
- white matter is central and appears relatively darker due to its relatively low density
Artefacts:
- beam hardening:
- when a relatively small amount of hypodense tissue is immediately adjacent to dense bone. Eg: posterior fossa
- Volume averaging (partial volume artefacts):
- For a particular image unit, the CT pixel produced will represent an average density for all the contained structures.
- Motion artefacts
- Ring artefacts
- Streak artefacts
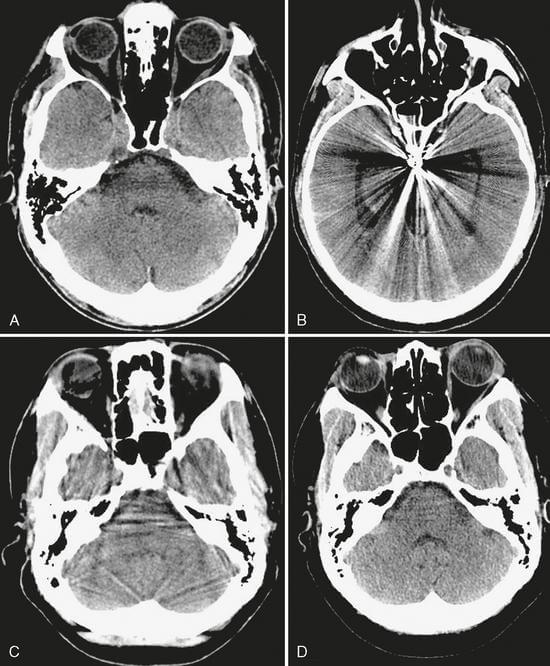
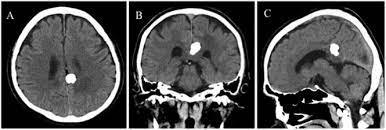
B. Aneurysm clip metal artifact.
C. Partial volume artifact is seen as streaks throughout the posterior fossa on this 5-mm thick slice.
D. Reducing slice thickness to 2.5 mm significantly reduces partial volume artifact
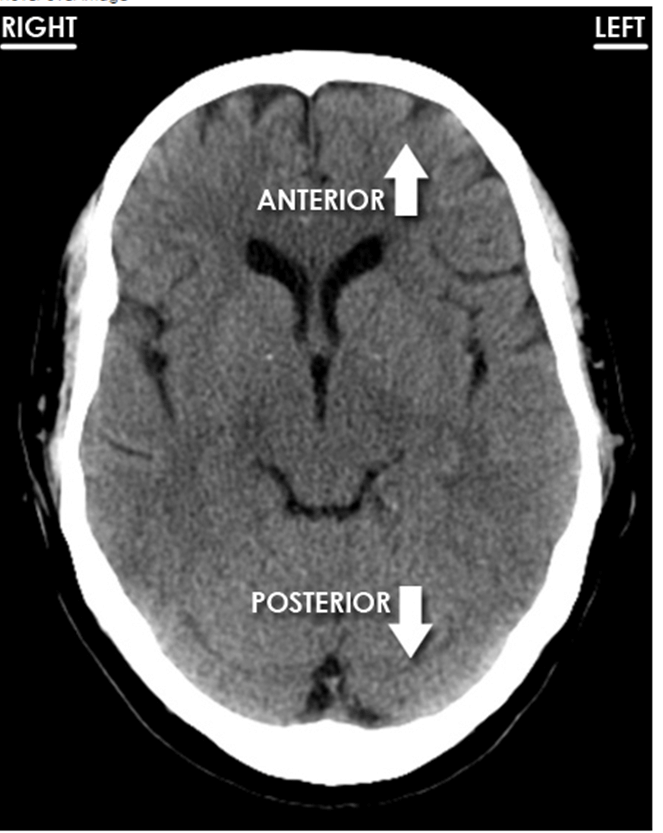
Different views:
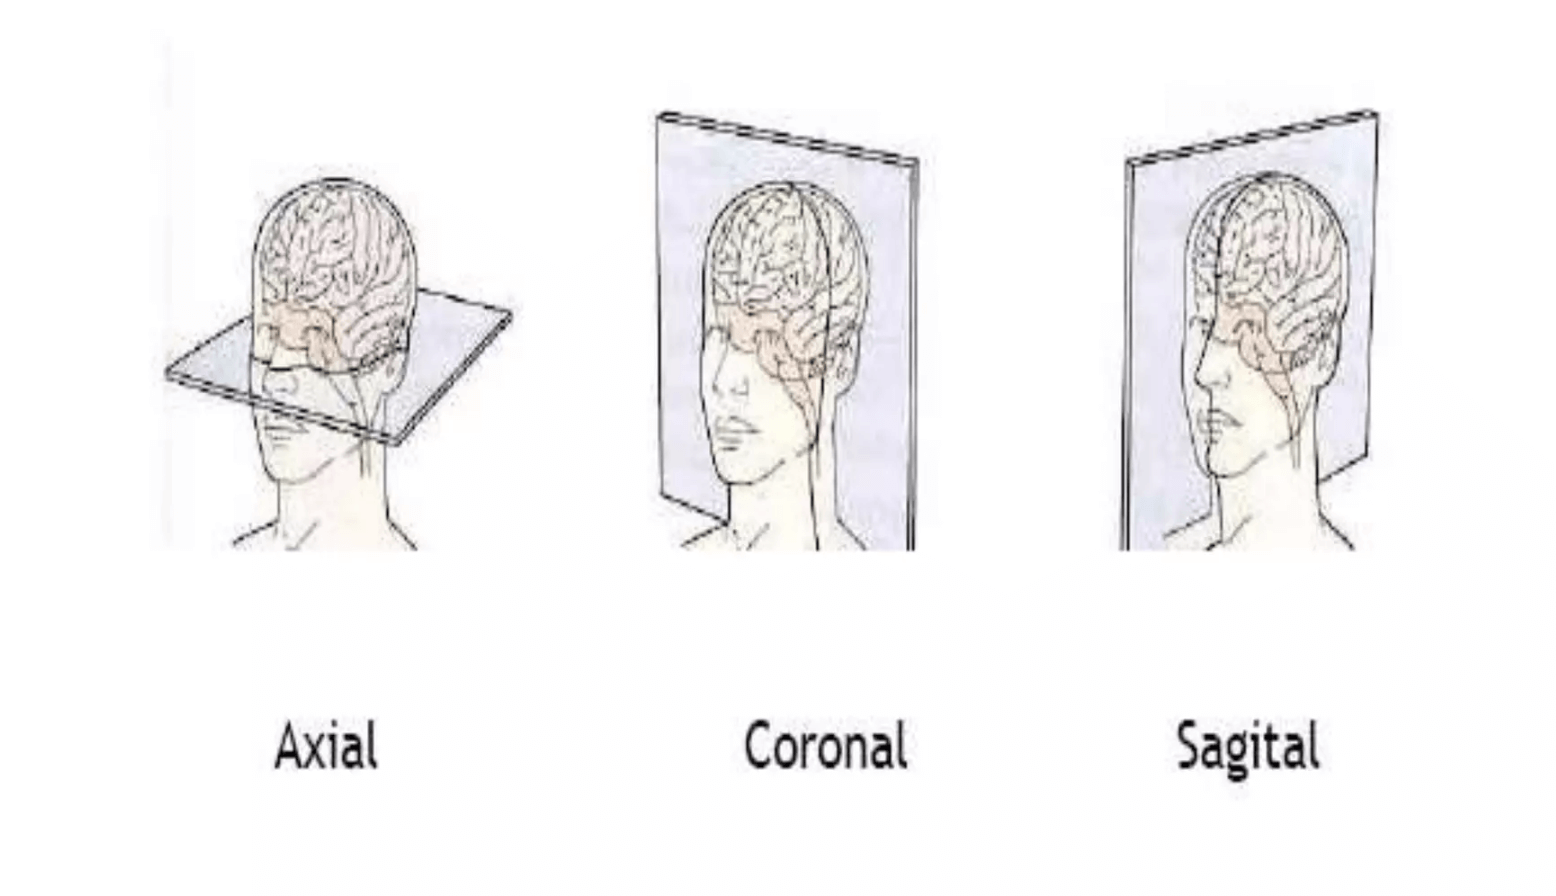
Orientation:
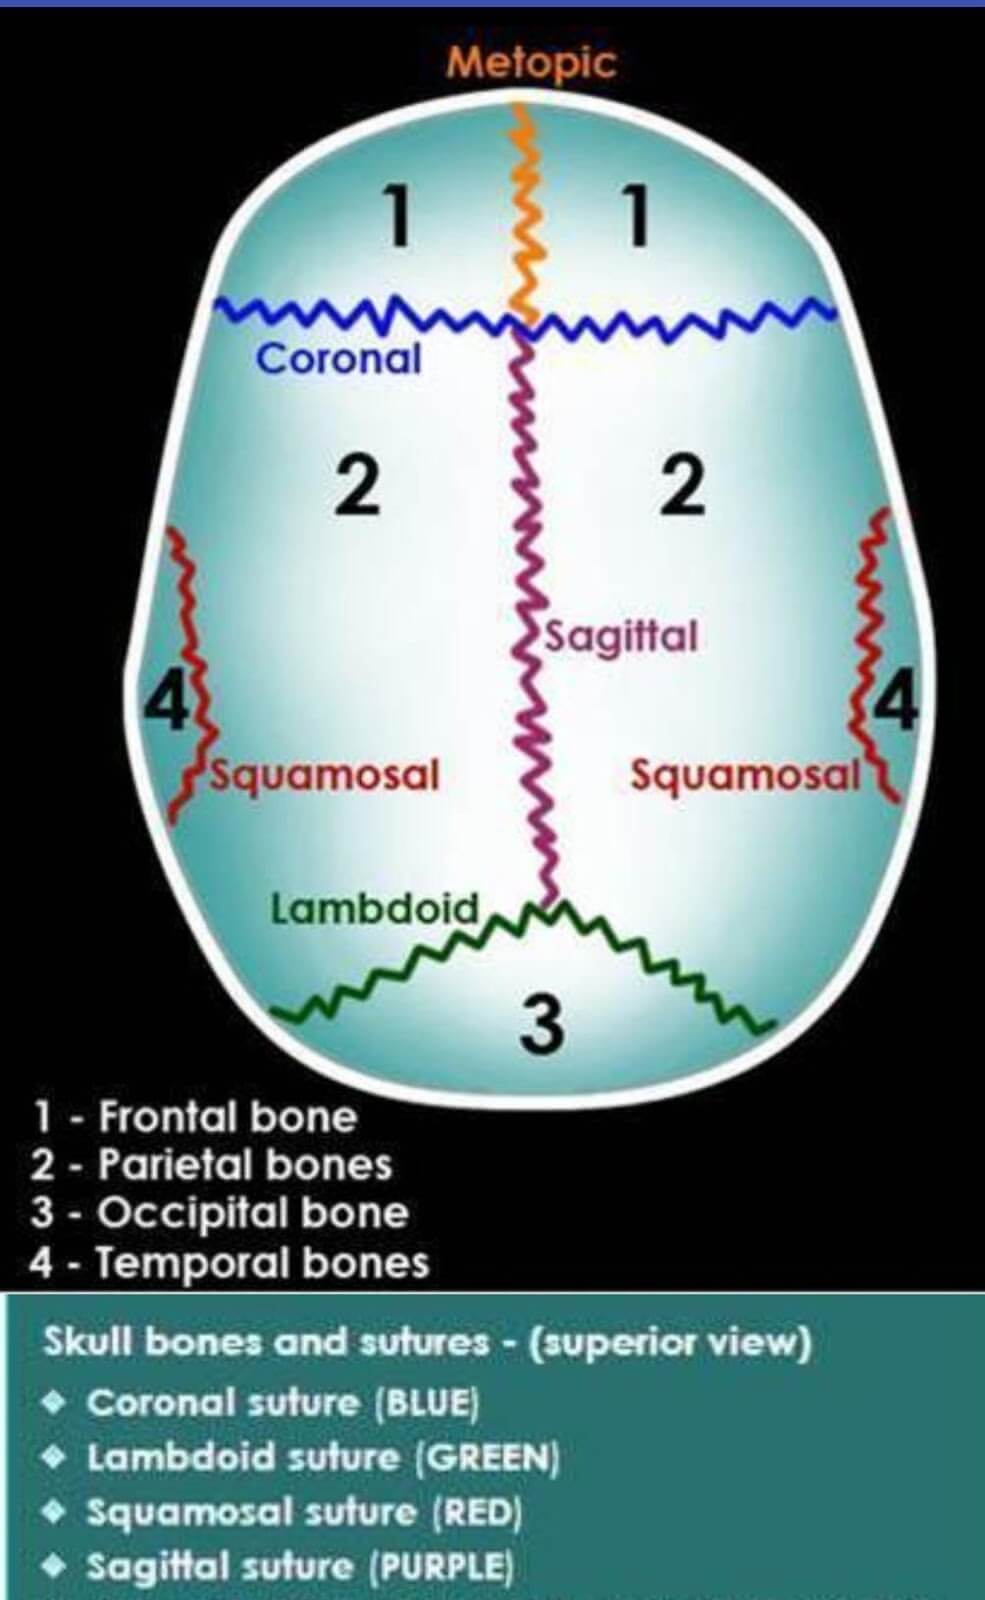
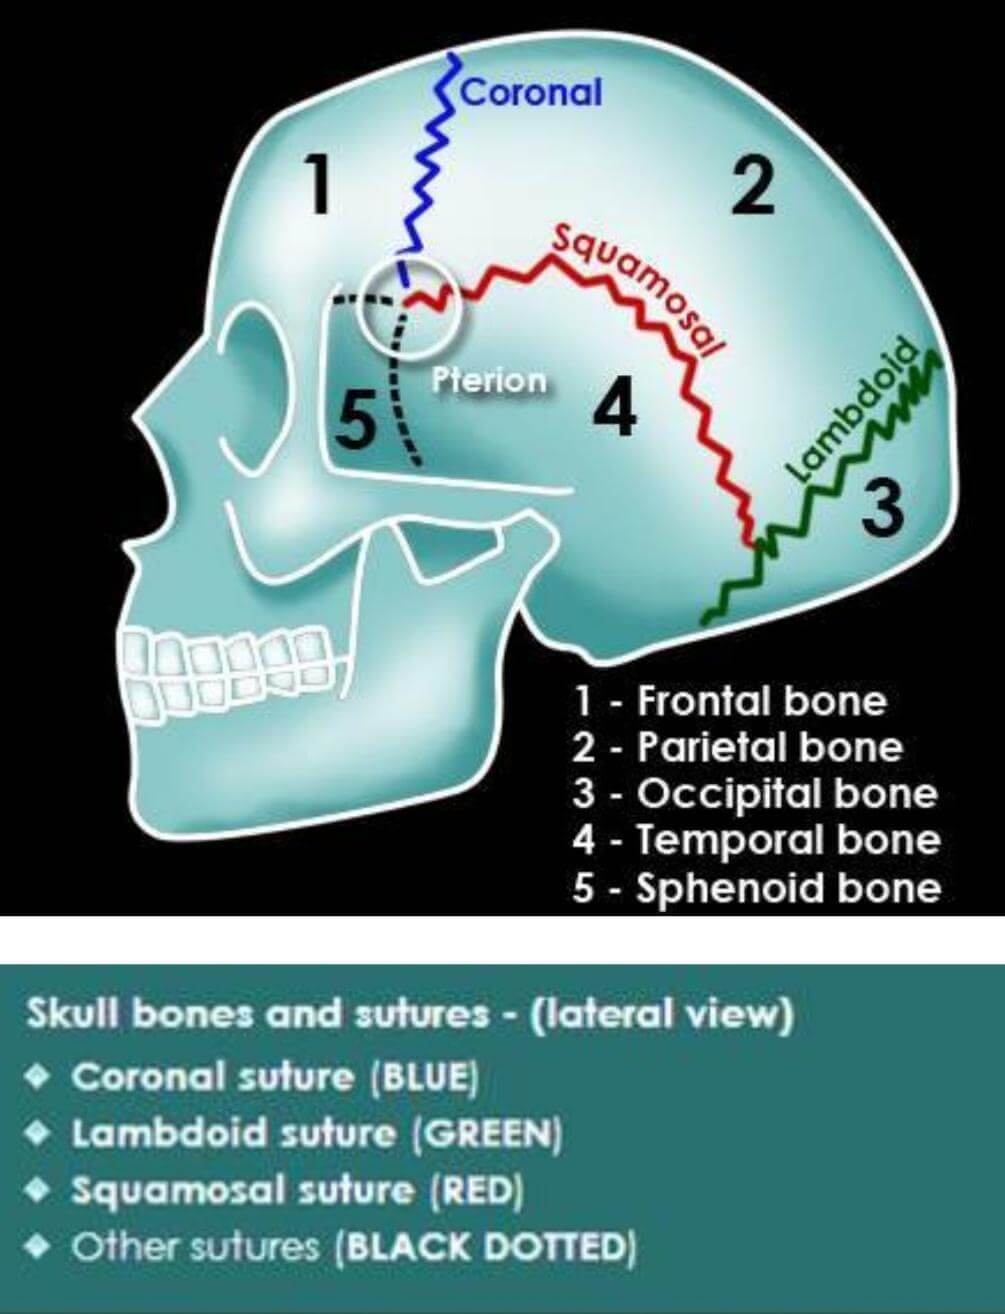
Skull bones and sutures:
Diagrammatic representation of bones and sutures are shown below.
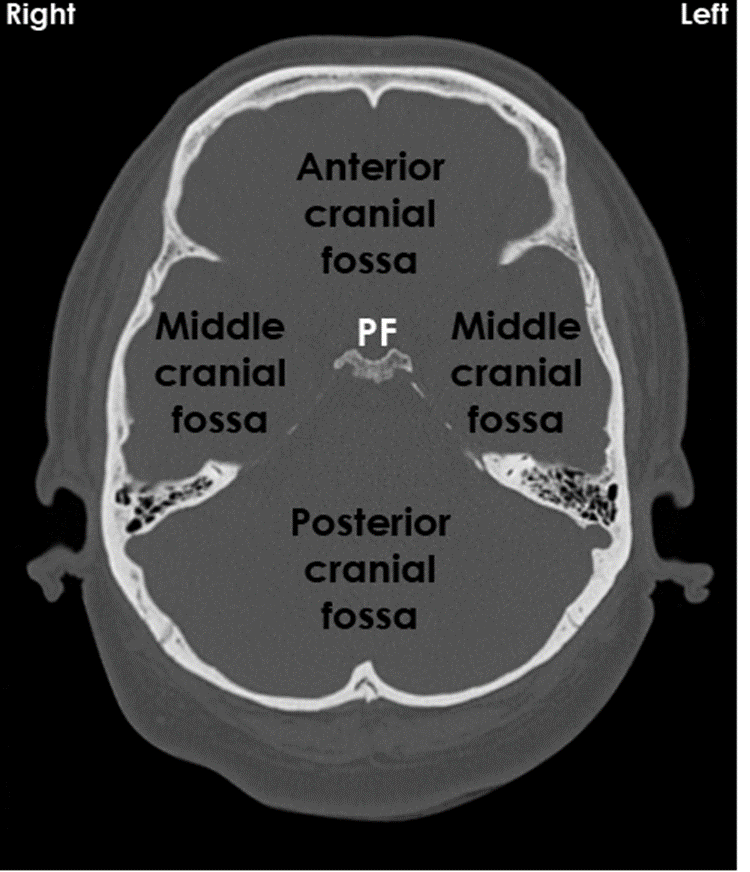
Cranial fossa:
Landmarks are 2 bones –
- Anteriorly is the lesser wing of sphenoid bone
- Posteriorly is the petrous part of temporal bone
- In between the two is the middle cranial fossa
- Anterior to anterior bone is the anterior cranial fossa
- Posterior to the petrous temporal is the posterior cranial fossa
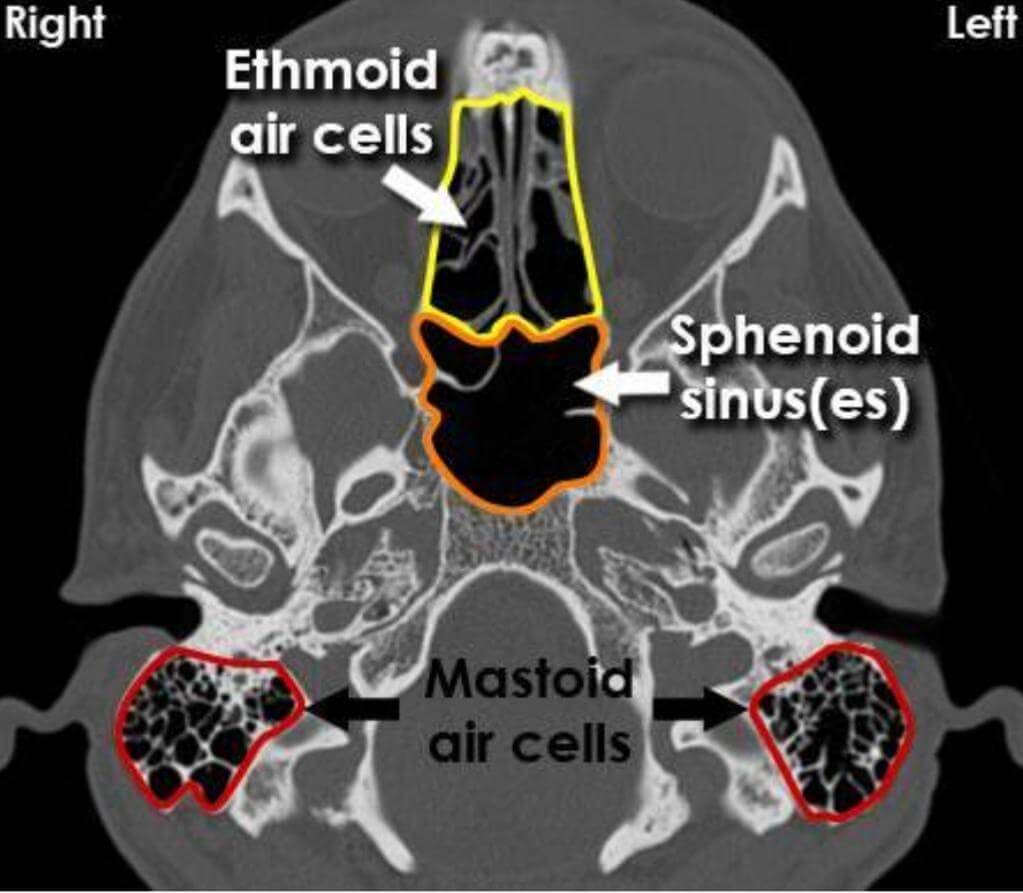
Sinuses in CT head (bone window):
5 sinuses in the picture below:
- Ethmoid
- Sphenoid
- Mastoid
- Maxilla
- Frontal
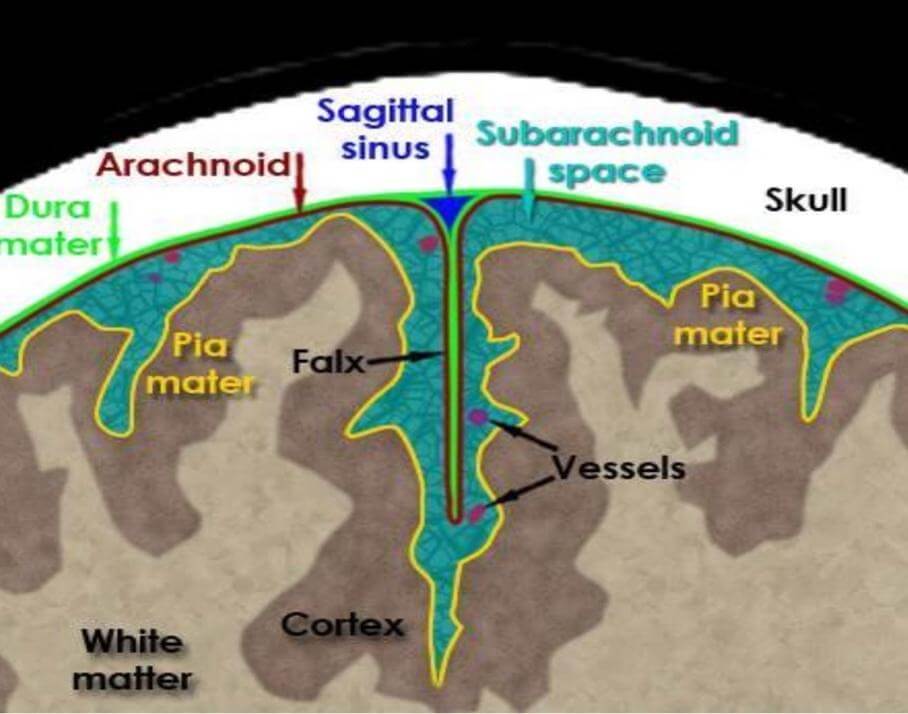
The meninges:
- Very difficult to identify on the NCCT head
- But the below pictures will give you some idea
- It is not always important to differentiate meninges
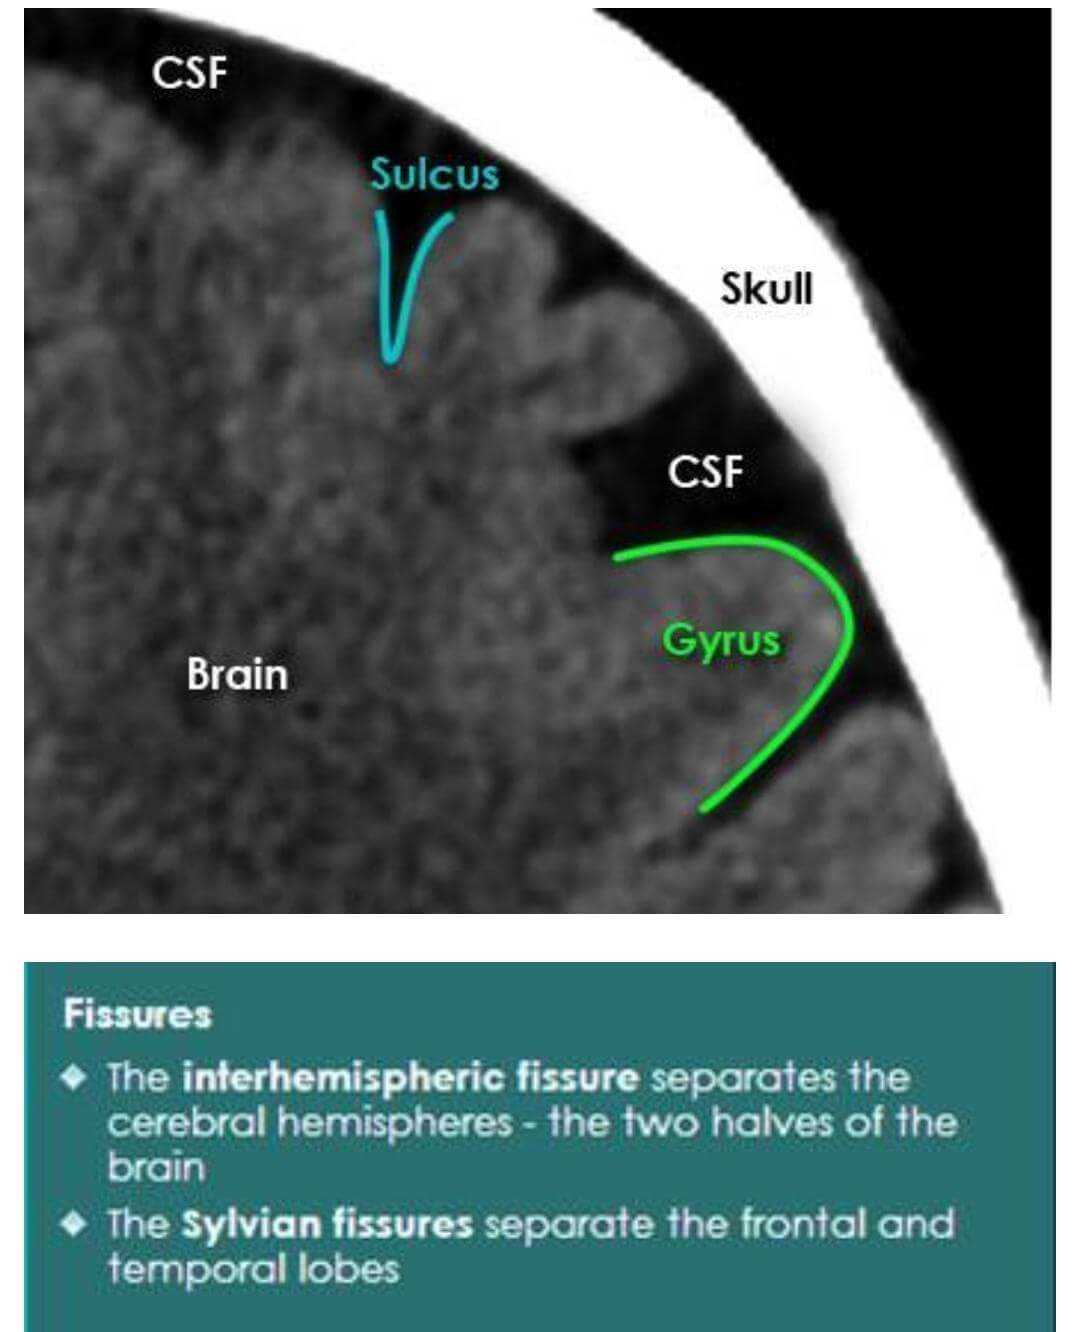
CSF spaces:
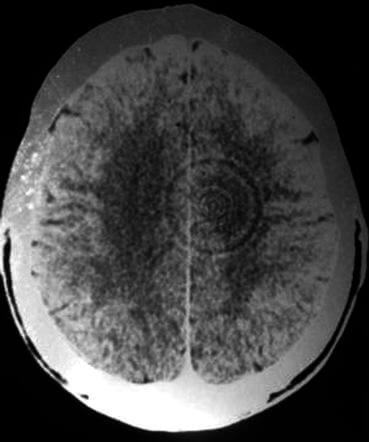
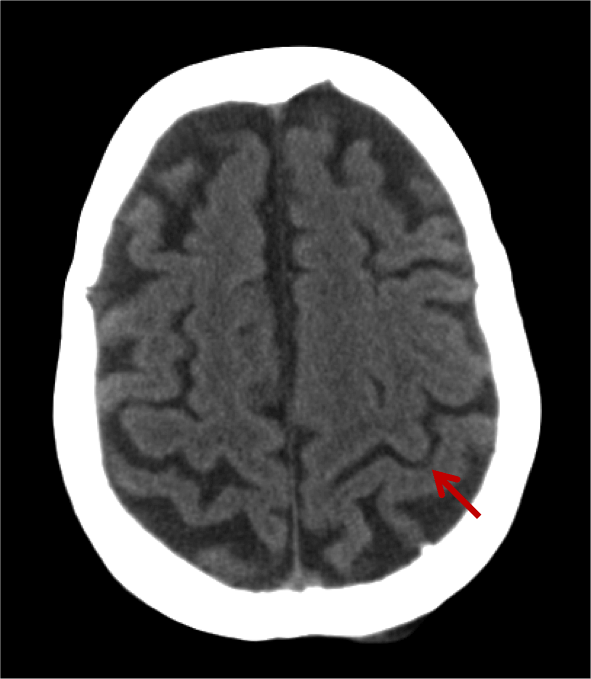
How to find the central sulcus?
- The red arrow shows reverse omega shaped structure – central sulcus
- It lies behind the superior frontal gyrus (the L shaped structure shown by the blue arrow)
- Central sulcus divides the frontal and parietal lobe
- Anything above the central sulcus is the precentral gyrus (motor area) and anything behind it is the post central gyrus (somatosensory area)
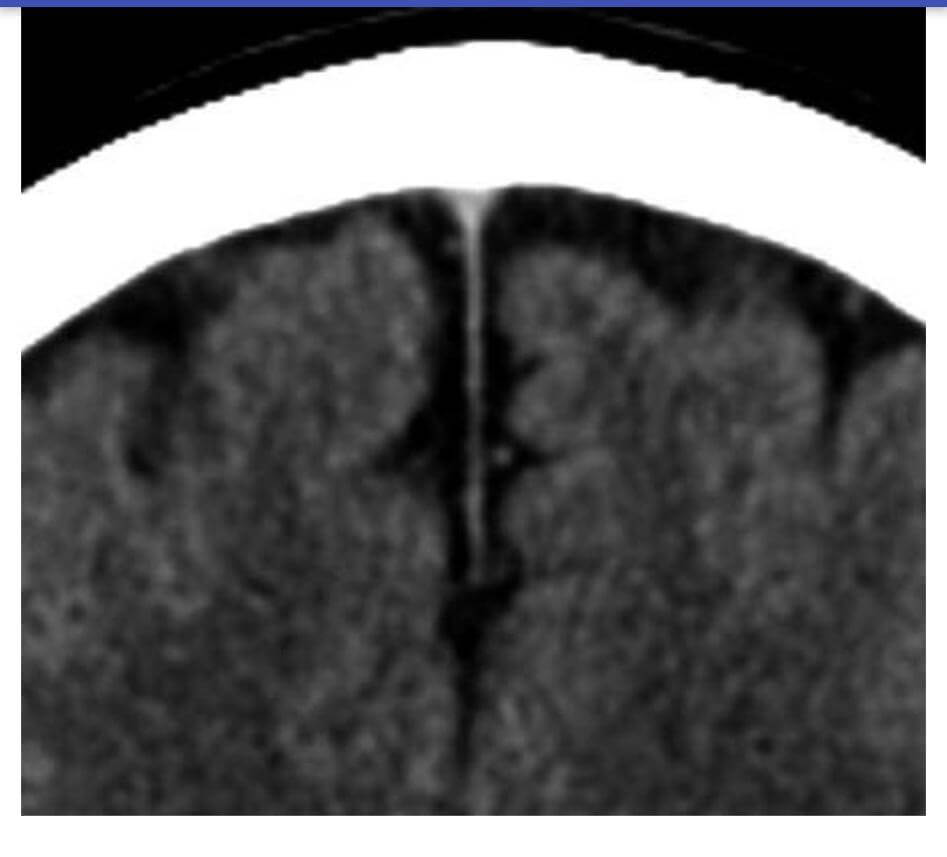
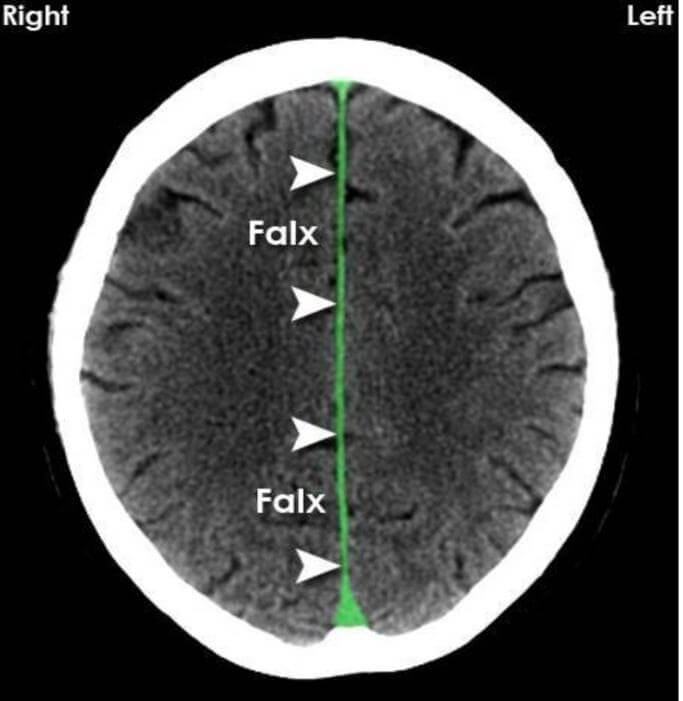
Falx cerebri:
- Divides the cerebrum into 2 equal halves
- Sometimes calcification can be seen in falx which is normal (do not confuse calcification with bleed)
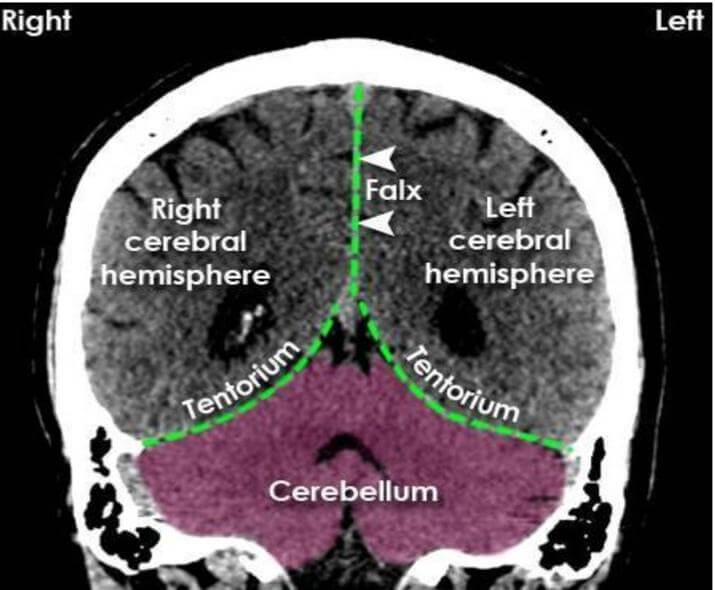
Falx and tentorium:
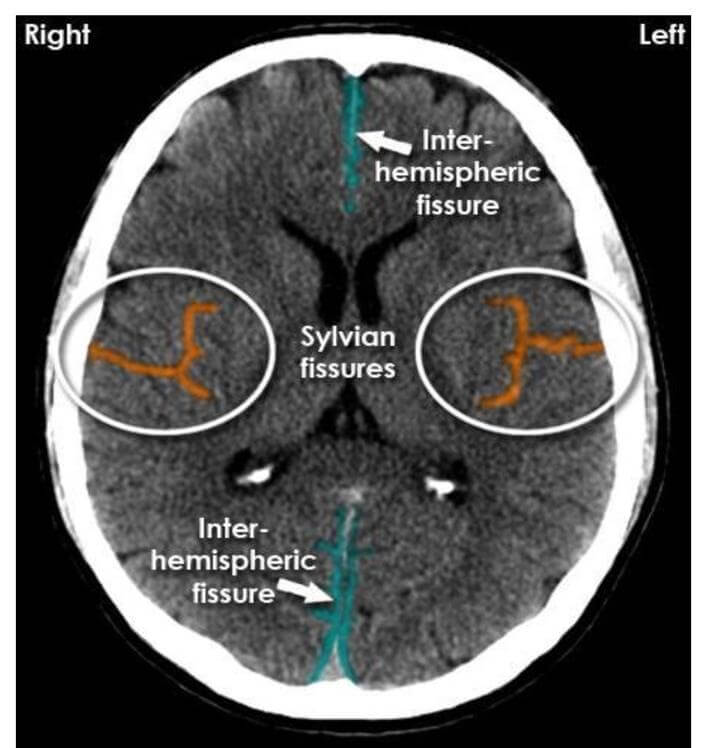
Fissures:
- The sylvian fissure divides the frontal, parietal and temporal lobes. (Above it is the frontal lobe, below it is the parietal and medial is the temporal)
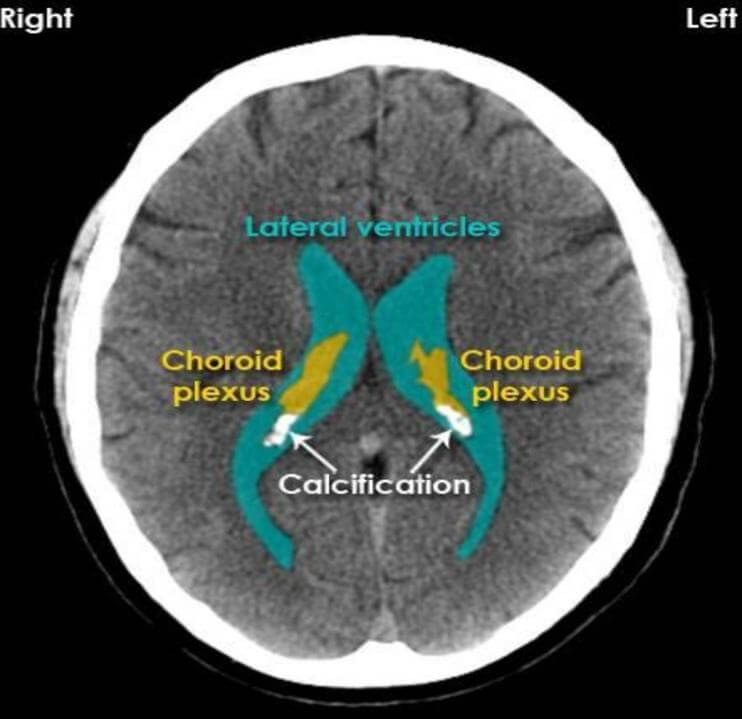
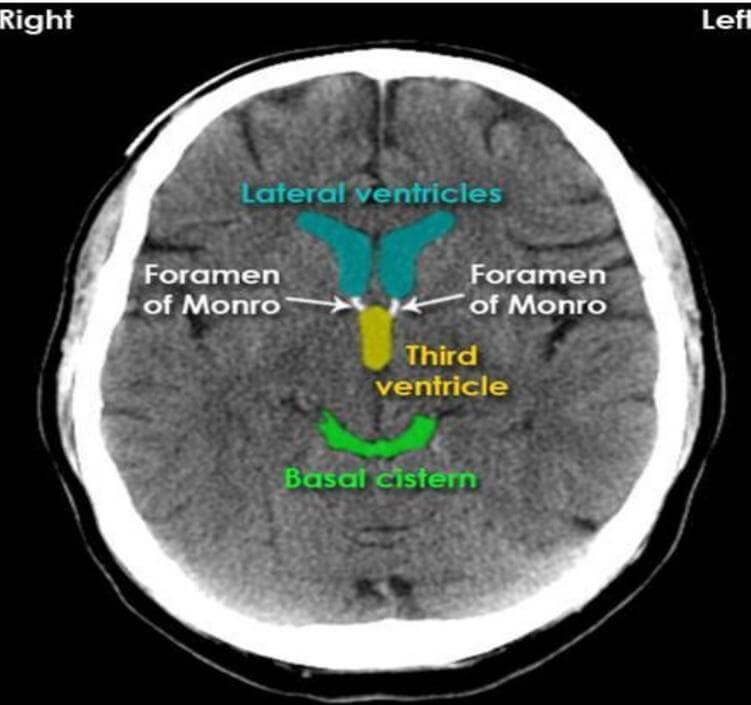
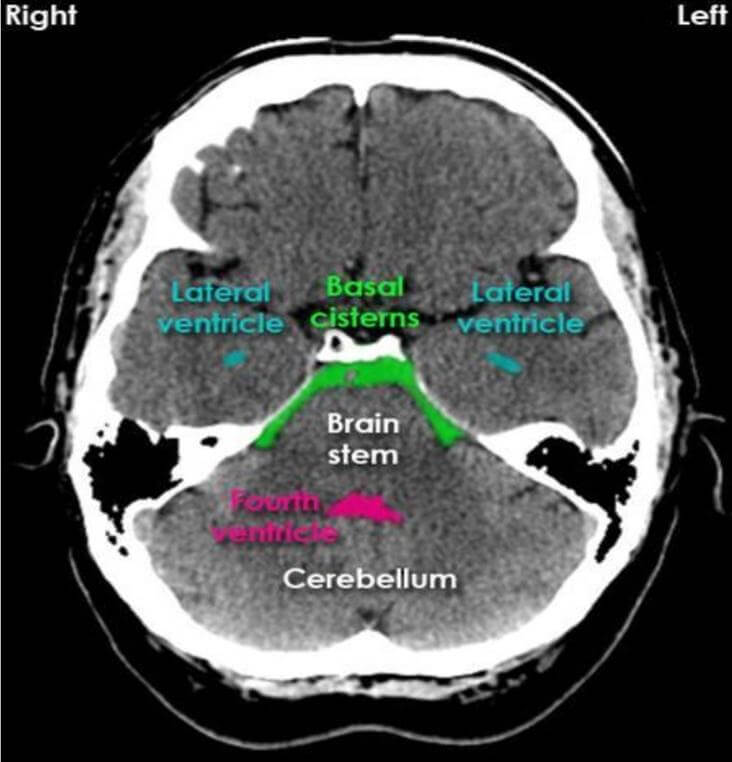
Ventricles of brain:
- 4 ventricles (2 lateral, third and fourth)
- Lateral ventricle has 3 horns (frontal, occipital and temporal horns)
- Lateral ventricle contains choroid plexus (sometimes calcification is seen in it which is normal; do not confuse with bleed)
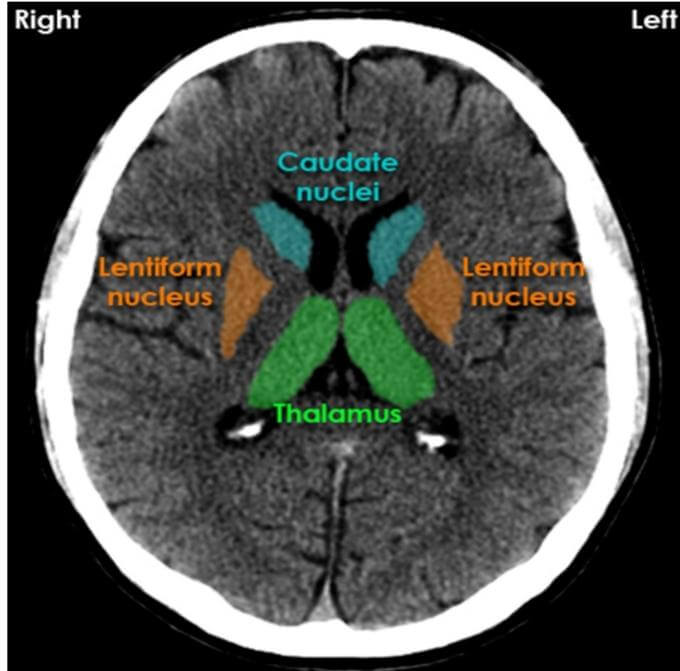
Basal ganglia and thalamus:
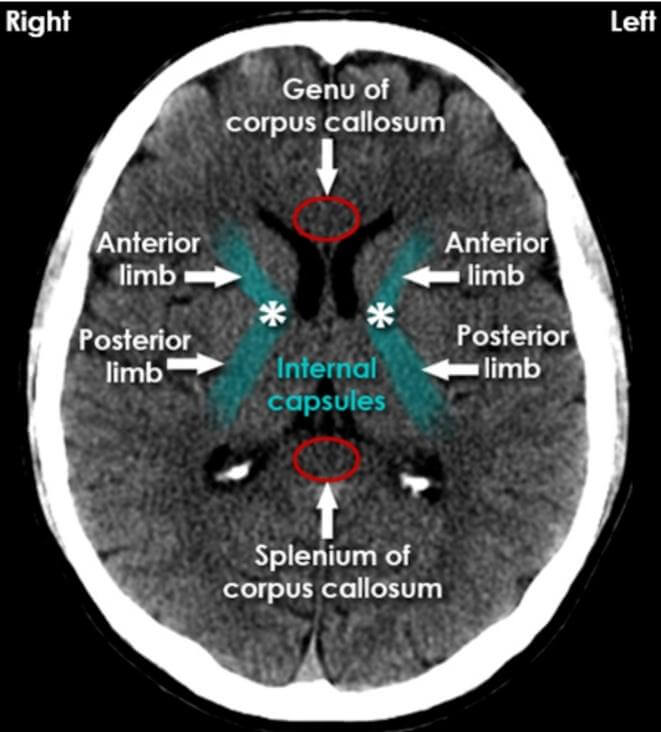
Internal capsules:
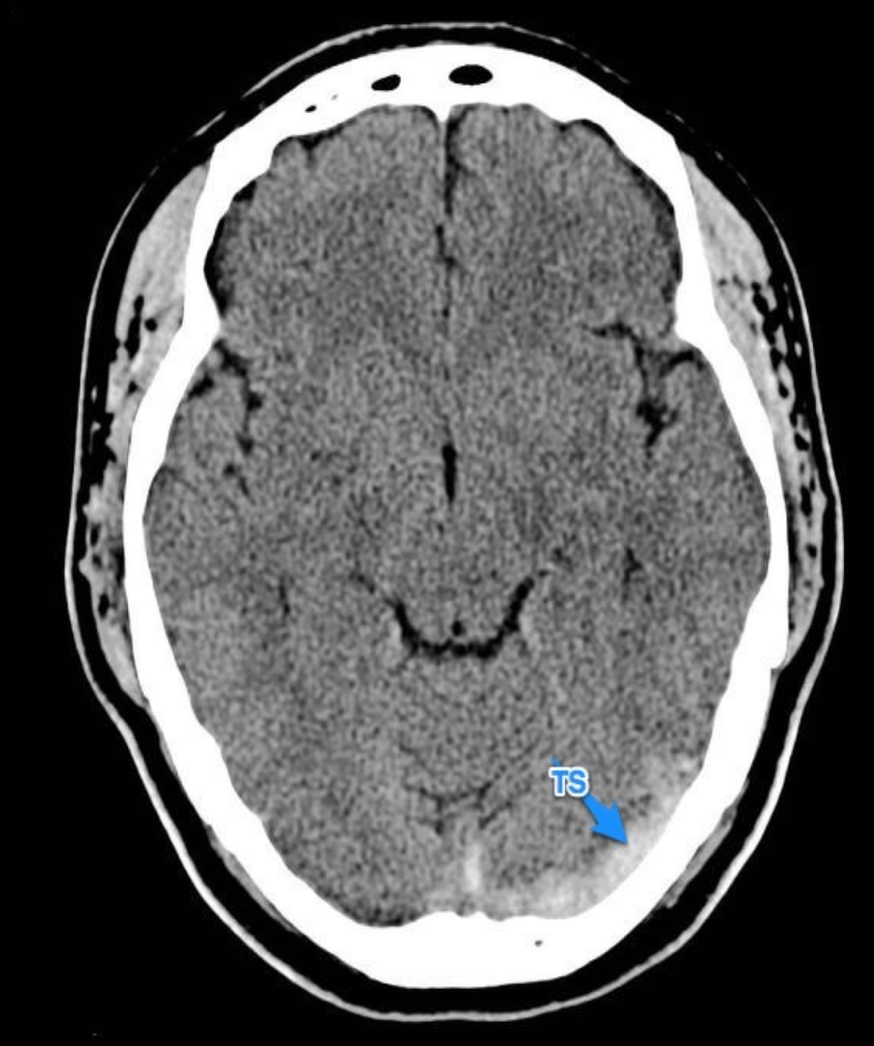
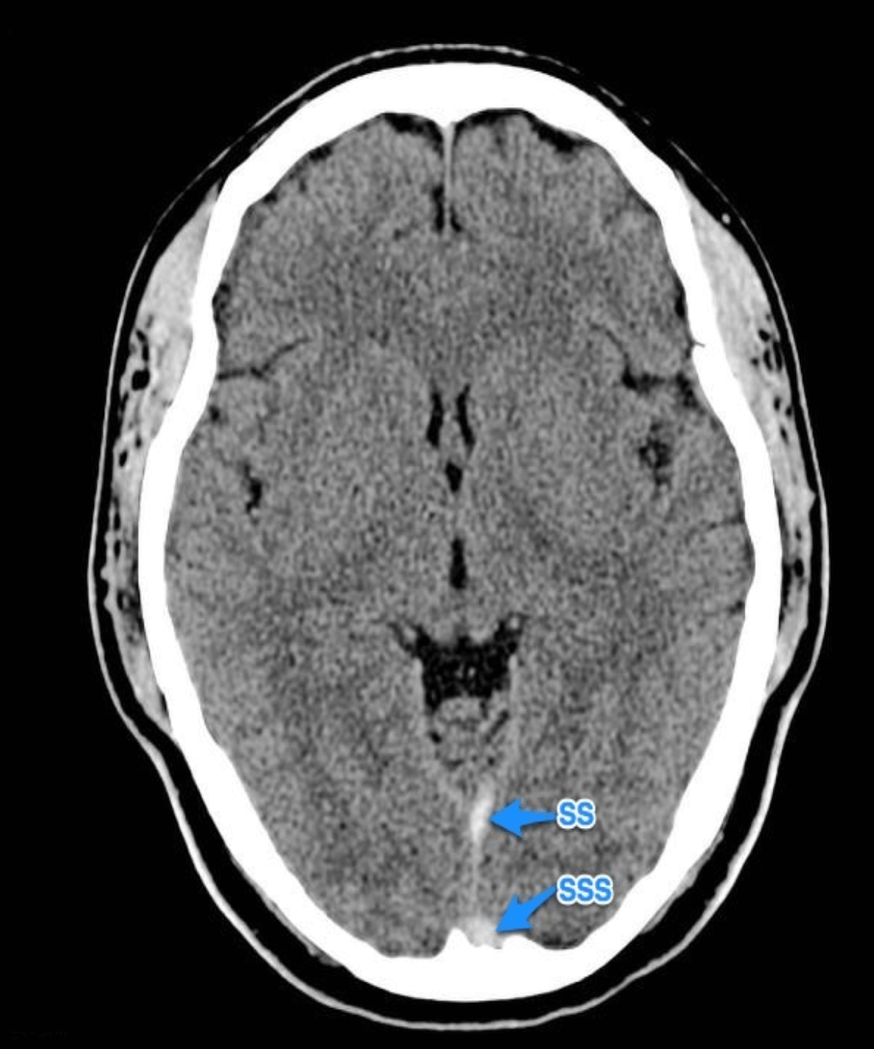
Dural venous sinuses:
- Superior sagittal sinus
- Inferior sagittal sinus
- Straight sinus
- Sigmoid sinus
- Occipital sinus
- Confluence of sinus
All of them cannot be appreciated in the CT. We will need MRV for appreciation of all the sinuses. Some of them which are seen is shown below.
Note: this article reviews the normal CT findings. We will have the next article that will show some abnormal CT scans.
He is an avid reader, guitar player, melodious singer and old songs lover. He has a passion for making medical knowledge accessible and comprehensive.